Navigation path
- EC
- Copernicus
- Emergencies
- Droughts
- EDO
- Drought Evolution
- Animations
Animations
Animations of thematic maps about drought can help to quickly perceive the development of droughts in time.
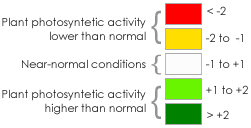
Here you can see an example showing maps of fAPAR Anomaly from 2003 to now.
Legend


