Navigation path
- EC
- Copernicus
- Emergencies
- Droughts
- EDO
- Drought Evolution
- CDI Time Animation
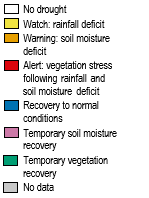
Animation of Combined Drought Indicator (CDI) maps during last year
Animation made with maps of the last 36 ten-day periods of the Combined Drought Indicator (CDI) v.3.0.On Wednesday 3 April 2024 at 9:00 CET, EDO and GDO have been moved to a new Internet domain that is part of the Copernicus Emergency Management Service (CEMS) main domain, being EDO and GDOe than 5 years key part of the Copernicus programme. This domain change will help you to get a better overview of all the information, data, and services provided by the Copernicus programme and make easier to switch from one to the other.
The domain change is automated for a year, but please update your bookmarks as soon as possible!
Welcome to drought.emergency.copernicus.eu!
The domain change is automated for a year, but please update your bookmarks as soon as possible!
Welcome to drought.emergency.copernicus.eu!
  | 2024-04-01 |