
Navigation path
- EC
- Copernicus
- Emergencies
- Droughts
- GDO
- Mapping Drought
- MapViewers
Drought MapViewers
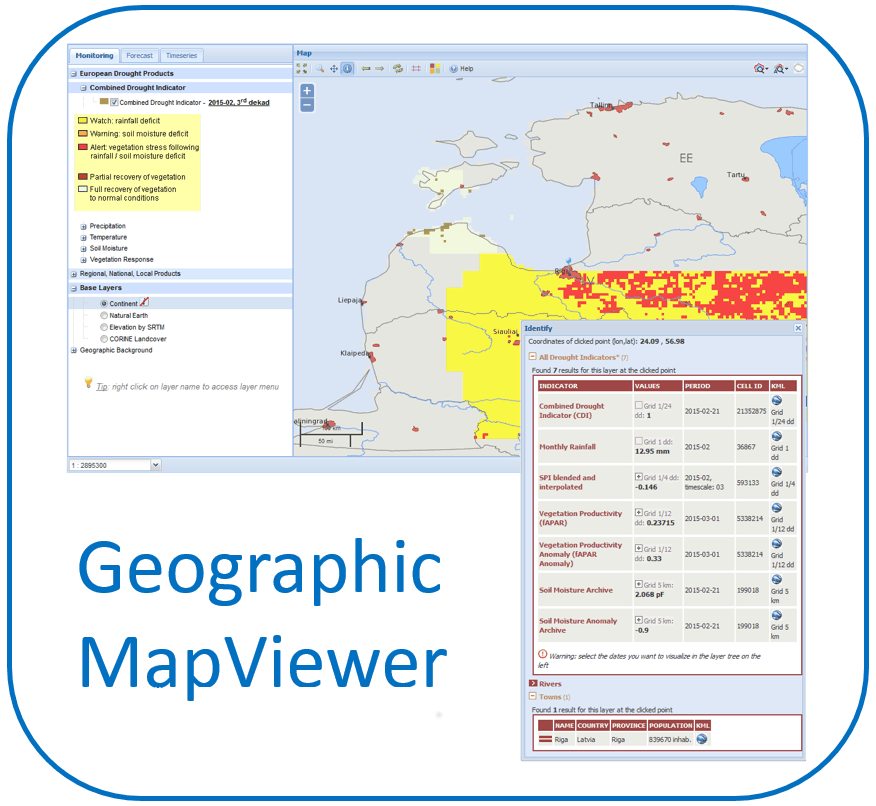
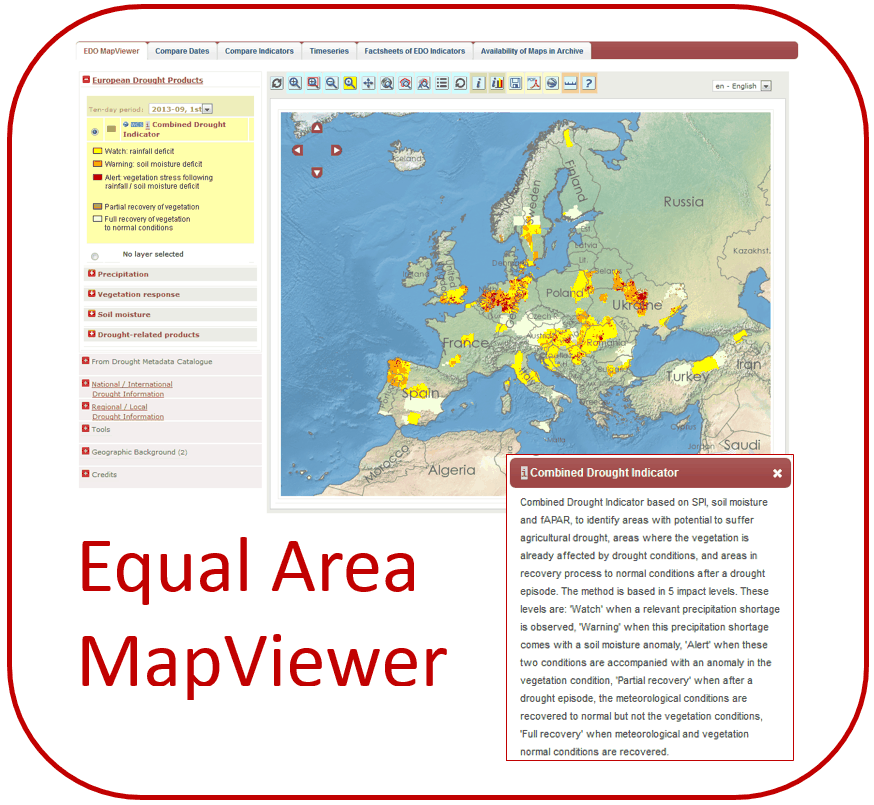
Explore maps of drought indicators in our web GISs.Droughts are complex to map both in time as in space. When does a Drought start, from the last rain? Up to where does a drought extent in space? Depending on the soil-type? In order to asses this precisely we provide here access to various spatial and temporal data sets. These interfaces are mend for specialists. People able to understand the many ins- and outs that determine the functioning of our land. For quick assessment we provide the Current Drought Maps.
The two services provided here creates maps in the Lambert Equal Area (LAEA) projection system or in a Geographic Plate Carree projection. The latter is more suited for WebGIS users. The equal area system is more useful for creating visual attractive maps, it can be slightly slower than the Geographic server. New functions are placed on the Geographic server. We also advertise here the use of the Map Generator for those wanting to create a Wall paper size map!.
 |
 |